
In 2016, Cyclistic launched a successful bike-share offering. Since then, the program has grown to a fleet of 5,824 bicycles that are geotracked and locked into a network of 692 stations across Chicago. The bikes can be unlocked from one station and returned to any other station in the system anytime.
The public data for Divvy Bikes has been made available by Motivate International Inc under this license. To preserve the data privacy, the customer data is not provided in this trip dataset. This means that it’s possible to connect pass purchases to credit card numbers to determine if casual riders live in the Cyclistic service area or if they have purchased multiple single passes.
This project aims to better understand how annual members and casual riders differ, so that the company could make effective markerting strategies and campaigns to convert casual riders to annual memberships.

Scenario
As a data analyst in the company, I’m working with the director of marketing who believes the company’s future success depends on maximizing the number of annual memberships. Customers who purchase single-ride or full-day passes are referred to as casual riders. Customers who purchase annual memberships are Cyclistic members. My team wants to understand how casual riders and annual members use Cyclistic bikes differently. From these insights, the team will design a new marketing strategy to convert casual riders into annual members.
Goal
How do annual members and casual riders use Cyclistic bikes differently?
Dataset
12 months trip record data from Dec 2020 to Nov 2021. The trip record consists of ride ID, ride types, starting datetime, ending datetime, starting station, ending station, member types. Trip duration, month and day of week are calculated based on raw data.
The csv files have been concatenated into one dataframe. Data cleaning process was carried out to eliminate trips with zero or negative time duration. Duplicated records weren’t found. Geographical information is incomplete to great extent, which was not used for analysis.
After cleaning, there are 5,478,022 valid trip records, where the longest trip lasts 38 days.
Tools
Python numpy, pandas, matplotlib, seaborn
Analysis summary
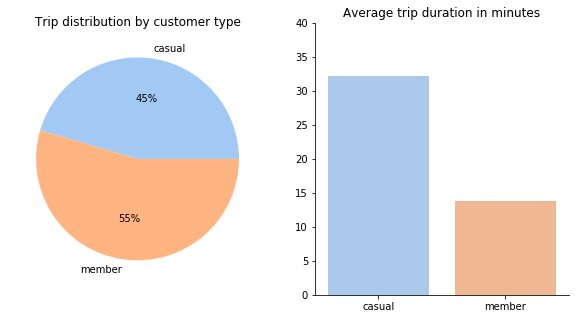
Among 5.5 million trips, the annual membership customer takes up 55% while the casual customer takes up the rest 45%. Casual riders tends to take longer trips than member riders, arounds two times of duration in average. Provided with mile charge information, the cost saving by subscribing memership can be estimated for the long trip riders.
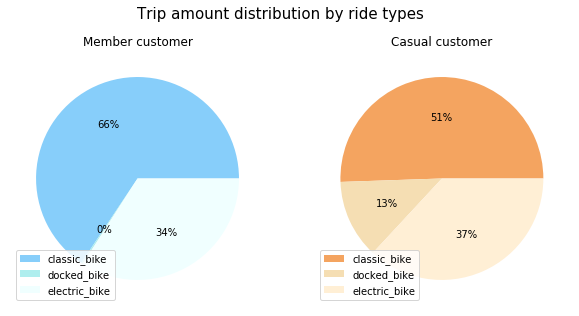
Classic bikes were mostly used by member riders and casual riders, which took up 66% and 51% respectively. Almost none of member riders chose the docked bike while the 13% of casual riders used the docked bike.
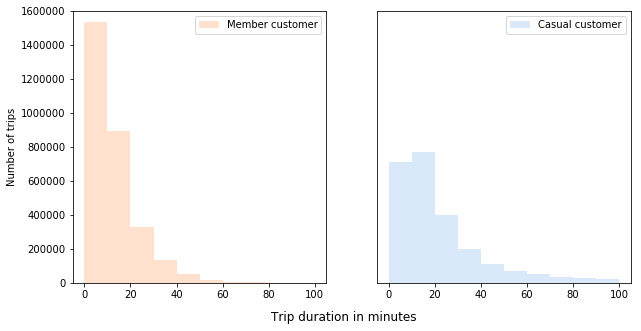
The largest amount of trips taken by member rider were below 10 minutes. The amounts of trip with less than 10 minutes and between 10 and 20 minutes were equally high for casual rider. Long trips above 30 minutes were much more popular for casual rider.
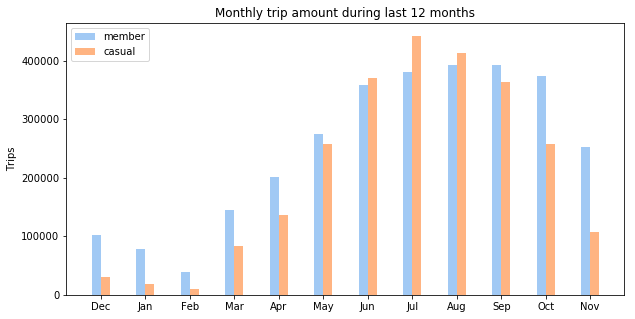
There were high demand of cycling service from June to September for both member rider and casual rider. The demand of casual rider decreased more rapidly than that of member rider. The membership conversion campeign could be carried out during the peak season when riders have more frequent need of bikes.
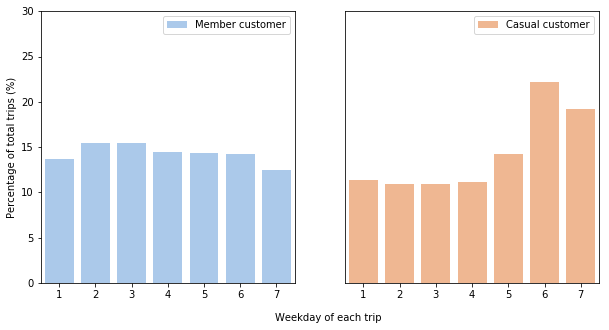
Rides were evenly distributed among days in a week for member rider. Casual rider used more bikes during Saturday and Sunday. The leisure use of bike was more significant for casual rider. To convince casual customers to subscribe annual membership, we could emphasize on the benefit of free long trips during weekends in membership program.
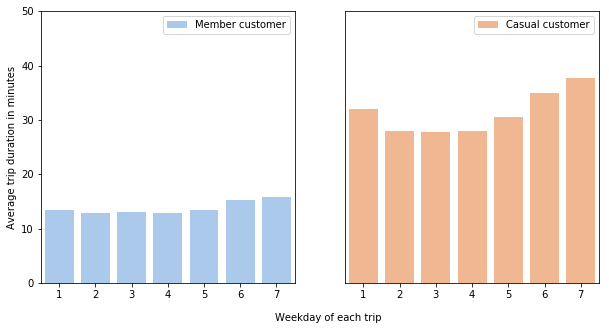
Among all weekdays, casual rider took longer trips than member rider. The longest average trip duration was on Sunday. Unlimited time of bike use would be an attractive membership feature for casual rider.
Conclusion and strategy
- Although casual riders take slightly less trips than member riders, casual riders spend much longer time during trips.
- Member riders take more trips below 10 minutes while casual riders take more trips above 20 minutes.
- The summer (from June to September) is the peak season for both member and casual riders.
- Casual riders take more trips during weekend while member riders take trips equally everyday.
To acctract casual riders to subscribe annual memership, the marketing campeign could be conducted between May and June when the customer starts to ride bike frequently and foresees the close future demand of bike service.
The marketing campeign should promote the membership program’s privileges on weekend use, long trip, and leisure trip. For example, the member could be given the right to reserve bikes during weekends, discounted price for long distance, family member sharing option and so on.
The tariff scheme should allow the subscription fee to be lower than the total fee of a certain number of long duration trips. If the customer data is provided, the specific casual customers could be further analyzed and targeted.