
Power sub-metering can bring a lot of benefits to residential customers. Instead of a bulk value of monthly electricity consumption given by the utility bill, sub-metering provides itemized energy consumption data by individual appliances. Consumers are awared of on-off status of appliances and power consumption in the real time. They can identify the abnormal use of appliances timely, monitor the use remotely, avoid the unnecessary use and improve the energy efficiency.
However, sub-metering by installing sensors or meters is not always economic in the appliance level. Data-driven nonintrusive load monitoring (NILM) is a low-cost alternative to smart metering to identify granular energy consumption data at appliance-level from whole-home energy data. NILM technology identifies the unique electrical signature (i.e. series of power changes) of appliances, and separates the individual power curve of the appliance out of the aggregate power curve.
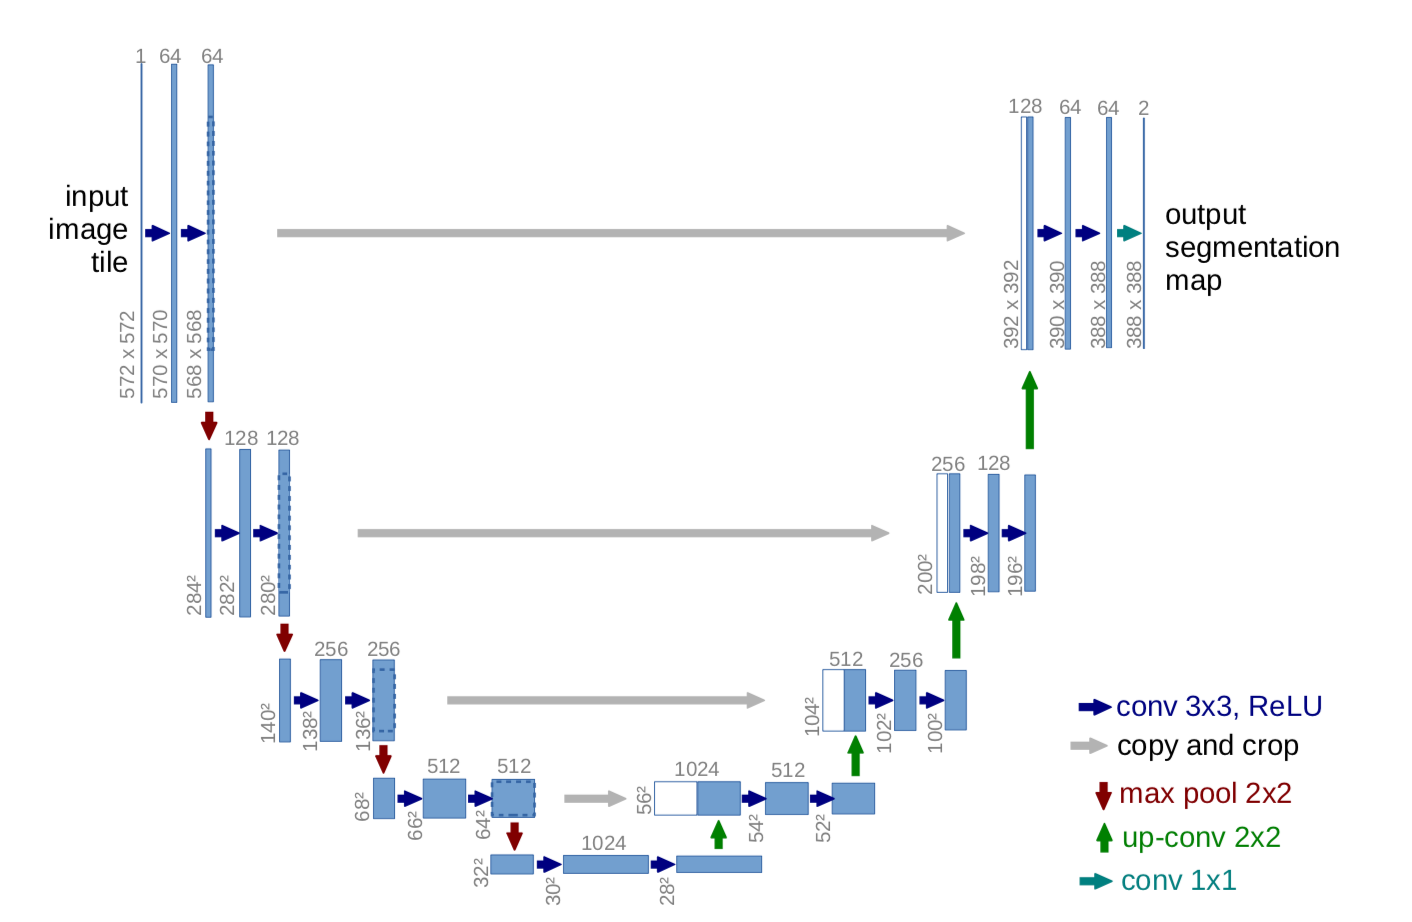
This project develops a machine learning based energy disaggregation algorithm, which adapts U-Net for 1-D time sequence to sequence translation. Input whole-home aggregate power curve, output individual appliances’ power curves.
REFIT Dataset
Many public load measurement datasets are available for research. This project primarily focuses on the REFIT Electrical Load Measurements dataset which includes cleaned electrical consumption data in Watts for 20 households at aggregate and appliance level, timestamped and sampled at 8 second intervals. This dataset is intended to be used for research into energy conservation and advanced energy services, ranging from non-intrusive appliance load monitoring, demand response measures, tailored energy and retrofit advice, appliance usage analysis, consumption and time-use statistics and smart home/building automation.
Open source NILM toolkit
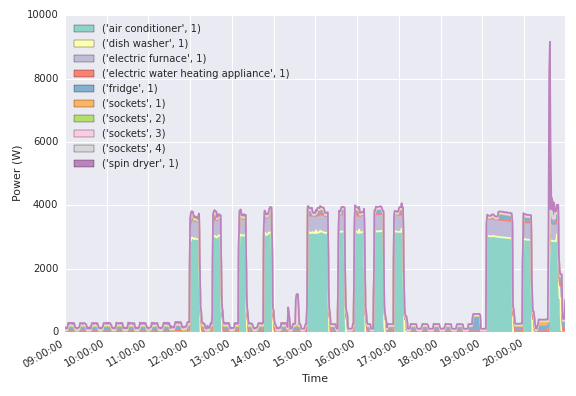
This proejct uses nilmtk python library to preprocess the raw data. This tool is designed specifically to enable the comparison of energy disaggregation algorithms in a reproducible manner. For example, plot_wen_on function in nilmtk visualizes when the appliances are above the defined power threshold in House 2 as the figure below.

Train and test results
- Train
Take dish washer as example, around one year measurement data from REFIT is divided into training set (75%) and testing set (25%), as showen in the figure below. The dish washer machine is turned on one or two times a day in average. Each time, it has three power peaks around 1500 W.

- Test
After training, the adapted U-Net model is tested and evaluated by the mean absolute error metrics. As the figure below presents, the prediction of dish washer power curve is quite close to the real measurement. Both low MAE value and the test figures prove the success of this U-Net based NILM algorithm.
It’s currently being compared to other state-of-the-art NILM algorithms.
